
For the testing of these e-drives, we implemented the data acquisition solution and evaluation for a large German automotive supplier. Power consumption and speed are relevant to evaluating the efficiency of electromechanical systems. Since the motors are permanently installed into vehicle body parts, often only the electrical current and voltage signals are all that’s available for quality testing.
Using the Current Signal to Determine Motor Speed
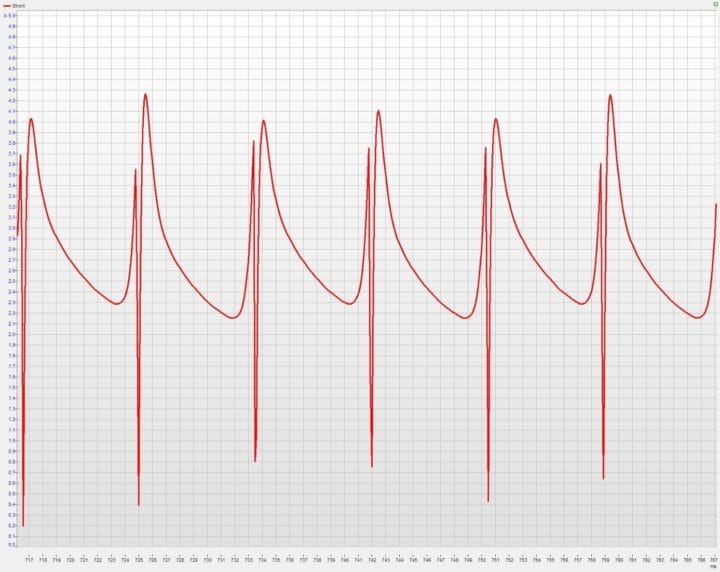
In a classic DC motor, the mechanical commutator leads to a brief drop in the current curve when poles are reversed. Depending on the design and number of poles of the motor, the quantity of current dips corresponds to one revolution. This model is also reflected in the current curve of brushless motors with electronic commutation.
Figure 1 demonstrates the current curve of a motor over time. The current pictured here was measured with a Q.bloxx XL A107 I/O module and a shunt. The current drops visible in this example occur during commutation at intervals of 8.4 ms.
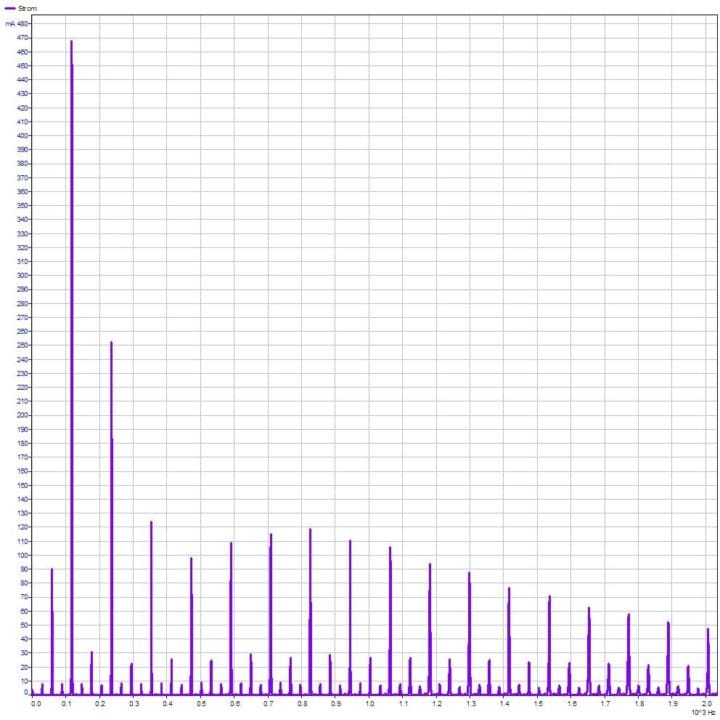
Accordingly, the spectrum of the current curve (Figure 2) shows its maximum occurs at 119 Hz. Assuming 3 commutations per revolution, this corresponds to a speed of 2380 revolutions per minute.
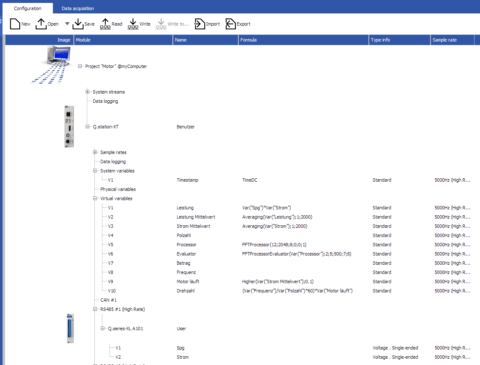
The spectrum can be performed both online and offline by Q.series X controllers. In this way, the engine speed can be determined continuously and live on the test bench using the current signal. The necessary configuration is performed in just a few steps.
Quick-and-Easy Configuration on the Test Bench
The FFT function of the Q.series X controller offers, among other things, the possibility to evaluate the maximum of a spectrum within a selected frequency band by magnitude and frequency. The frequency of the maximum corresponds to the fundamental wave and is divided by the number of poles and multiplied by 60 to give the speed in revolutions per minute (rpm). Also, the current is used to detect whether the motor is in operation and whether the electrical power can be calculated.
This edge computing allows the motor speed to be determined without a separate computer.
Depending on the test bench configuration, data can now be transferred to the system control, e.g., via EtherCAT or visualized within GI.bench on the test bench PC or over the local network.
Simply Powerful Visualization
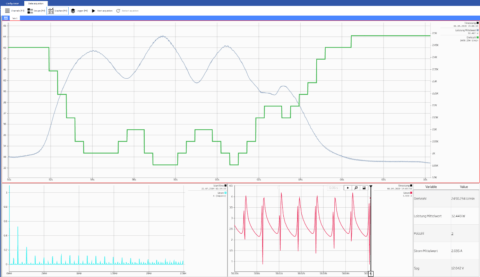
With GI.bench, you can create custom dashboards for visualization. Figure 4 shows the speed and power in the upper chart. When the motor is loaded, the speed decreases (green curve), while the power consumed increases (grey curve). Also, the current spectrum (blue), the current trace (red), and the parameters (table) are displayed numerically in this interface.
For references, demo programs and questions you can always contact us at info@gantner-instruments.com.
More articles
Q.series X A107 SV: Universal Measurement Module with Sensor Supply
Gantner Instruments' Q.series X A107 4 x Lemo 2B SV module is an adaptable and precise universal measurement module designed for engineers who need accurate data acquisition in distributed installations. This module, which is part of the modular and scalable Q.series X product family, now includes programmable sensor supply voltage and current limit capabilities per channel.
Read more...Gantner Instruments Sponsors STEM Education
The world is changing around us. Advances in technology impact everything, especially the world of work. It’s predicted that future workers will spend more than twice as much time on job tasks requiring science, math, and critical thinking than today. At Gantner Instruments, we recognize the importance of STEM education: it holds the keys to success for kids facing a world where STEM knowledge is imperative. For that reason, we are proud to be a Platinum Sponsor of Students for the Exploration and Development of Space at the University of California, San Diego (SEDS UCSD).
Read more...Gantner Instruments Environment Solutions celebrates its 10th company anniversary and starts with a ground-breaking ceremony for the construction of another company building
Over the past ten years, Gantner Instruments Environment Solutions GmbH has grown into a global market leader of monitoring and control solutions for large-scale solar systems.
Read more...Experience a New Level of Possibilities With Our New Website!
We are thrilled to announce the launch of the new Gantner Instrumentswebsite and introduce you to a few of its features.Here’s a sneak peek of what you can expect to […]
Read more...