Introduction to EIS
The analysis of the inner resistance at various frequencies of an electrochemical system, such as a battery cell, a fuel cell, or an electrolyzer, is called electrochemical impedance spectroscopy (EIS). With this measurement technique, e.g., battery cells, modules, and packs can be tested while under charge or discharge conditions to see the behavior and chemical processes when the battery is stressed. This is also known as online impedance spectroscopy or high-power electrochemical impedance spectroscopy when performed on higher voltage potential and charge currents in case of a battery of 1 or multiple C rates.
Modes of EIS Measurement
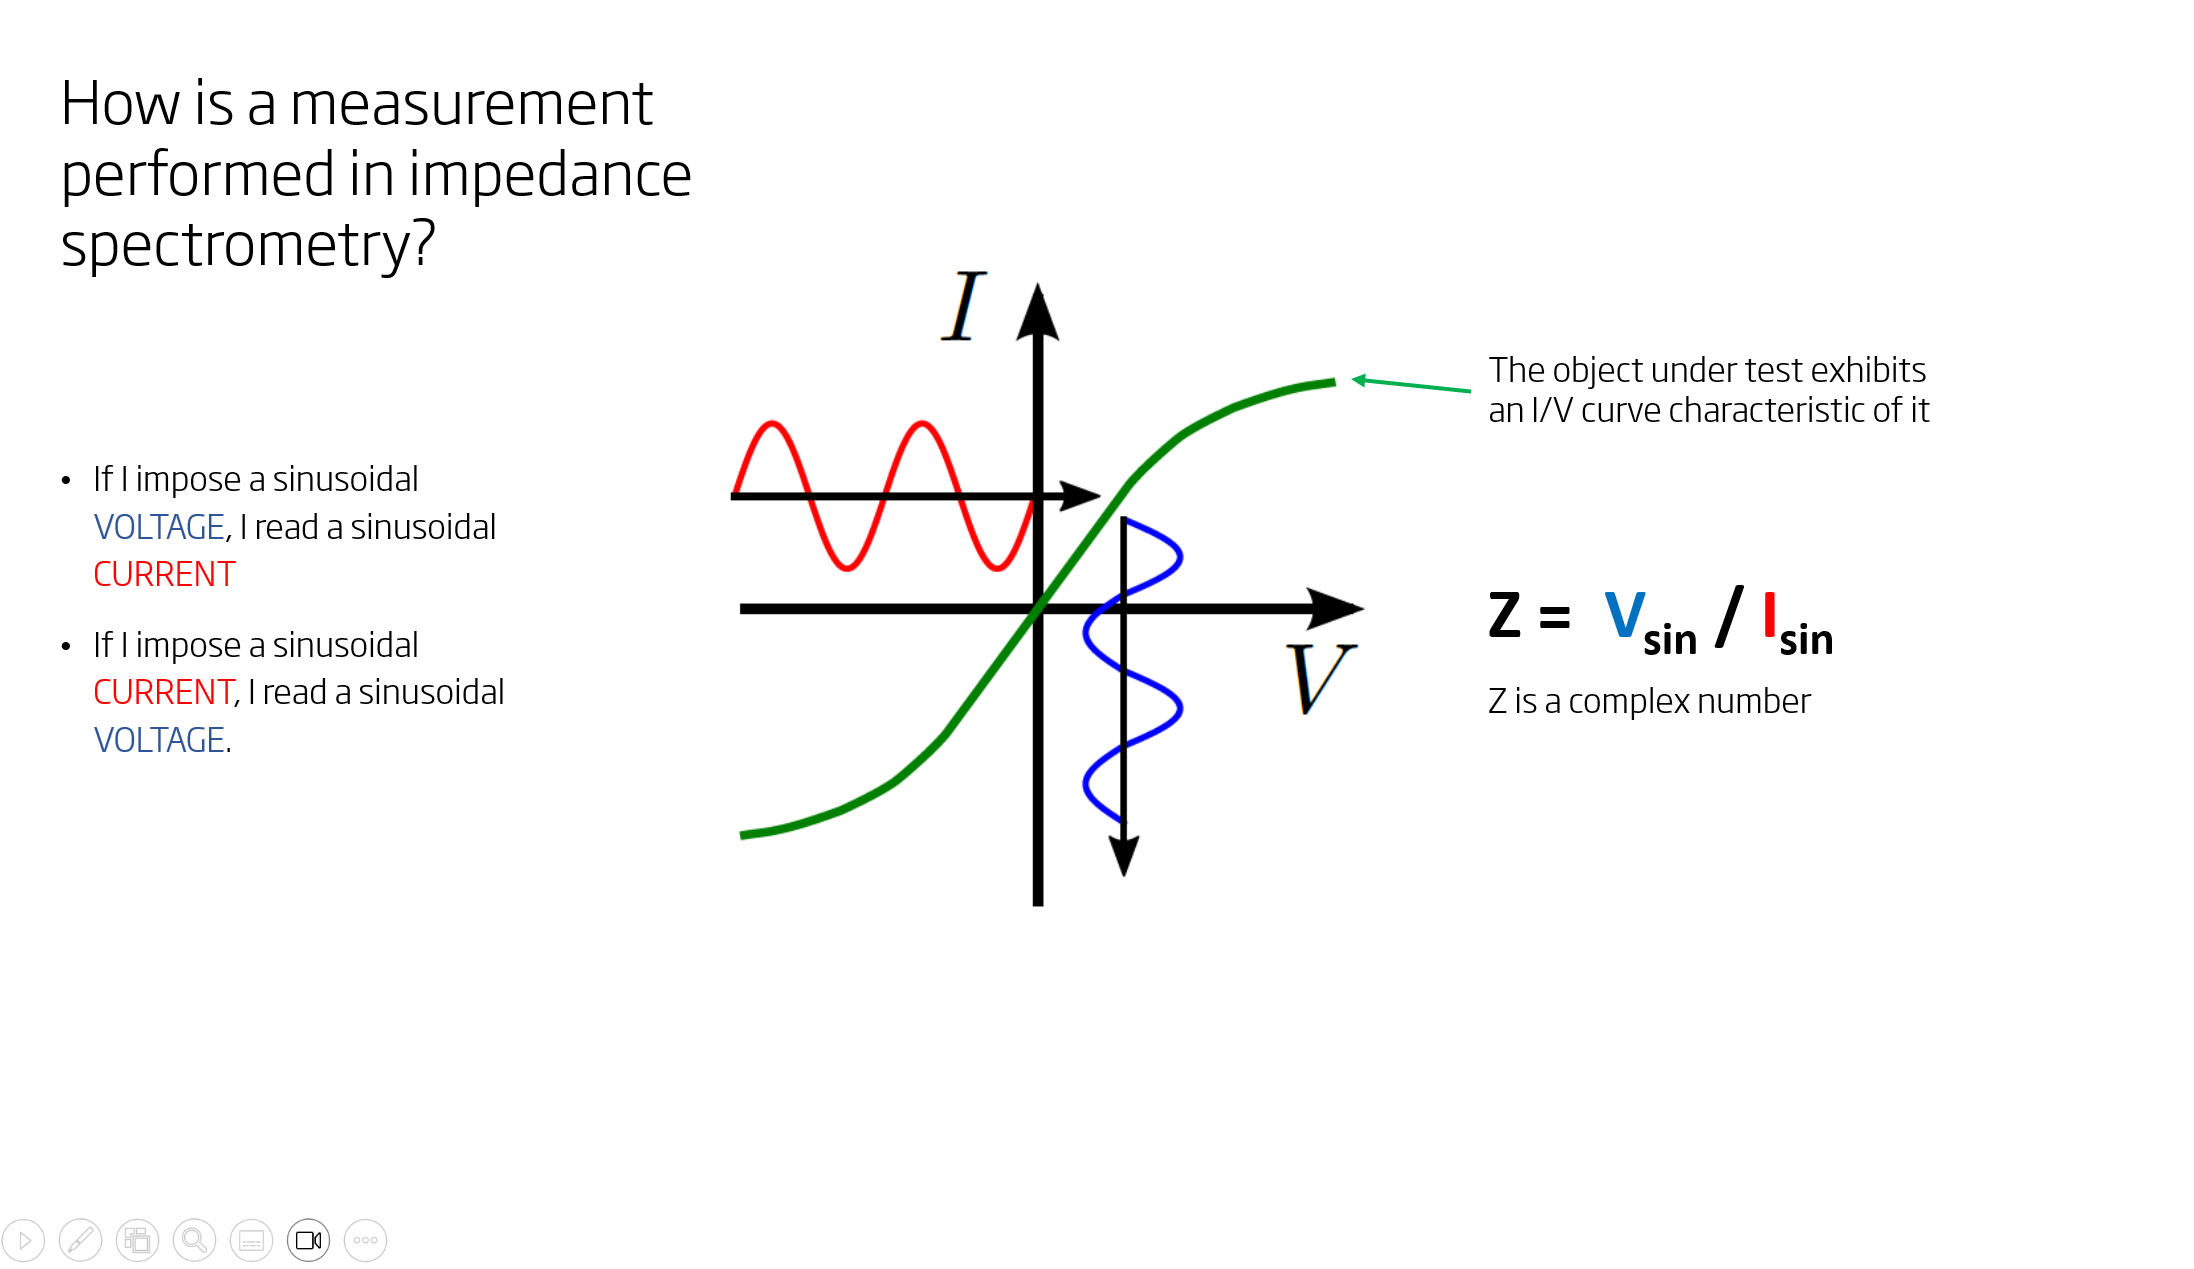
This electrochemical impedance spectroscopy technique generates current excitation of certain frequencies and measures the voltage response (galvanostatic mode). Alternatively, it generates voltage excitations and measures the current response (potentiostatic mode). The galvanostatic mode ensures that the SoC does not drift during the measurement and is, therefore, preferred for battery cells. With the voltage and current readings, the complex impedance can be calculated.
Implications of Phase Shift and Impedance
The time lag of the voltage response causes a phase delay of the voltage to the current excitation during the frequency measurement. This phase shift results in a complex impedance with a real and imaginary part. Impedance is only defined for linear systems. Nevertheless, it can be applied to a non-linear system as a battery if its impedance can be approximated as being linear and time-invariant (i.e., Linear-Time-Invariant LTI condition), meaning that the complex impedance was linear and did not change over time during the measurement, or at least was very close to linear and did almost not change over time; this is usually the case when, e.g., the requirements, amongst others, are met:
- The temperature of the cell does not change too much during one measurement.
- The open-circuit voltage (OCV) does not change too much during one measurement.
Practical Challenges and Solutions
In reality, the temperature of a cell will change because of the charge or discharge current and the OCV is dependent on the State-of-Charge (SoC) and temperature. As they change, the change in OCV is unavoidable as well.
However, accurate and repetitive measurements of SOC and cell temperature after each measurement can help to evaluate how much these changes interfere with the quality and accuracy of the impedance measurement.
Technical Considerations for Effective EIS
The amplitude of the current excitation should be low enough not to influence the behavior of the cell but large enough to provide a sufficient voltage response with respect to the signal-to-noise ratio (SNR) of the used data acquisition system. That means the DAQ system must have a very good SNR, to be able to measure the tiniest voltage response signals in the mV range. The frequencies of most interest for entire battery packs, for example, are between 10 mHz and 2kHz. However, for battery cells, fuel cell stacks, and electrolyzers, a common frequency range is 1 mHz to 10 kHz (sometimes up to 20 kHz). With, e.g., 10 steps per decade as a sweep or multi-sine measurement.
Visualization of EIS Data
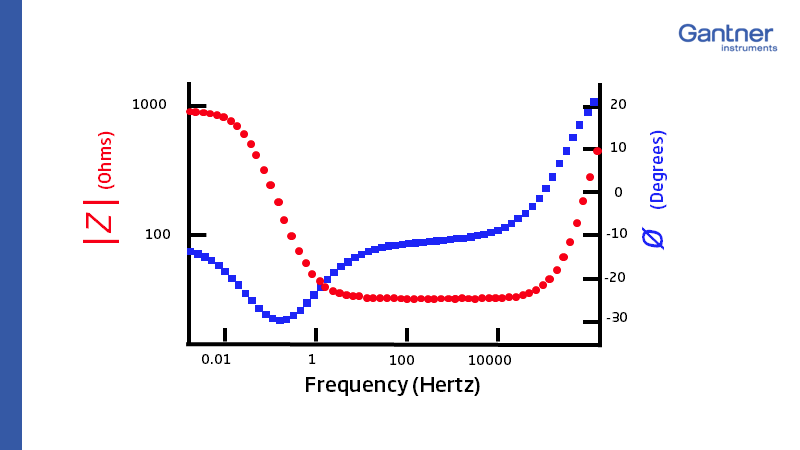
After measuring several frequencies, the complex impedance can be drawn in the characteristic Nyquist plot, in which -Zimg is plotted on the Y-axis over Zreal on the X-axis. Each point in this XY-chart is the result of one frequency. Another common visualization is the Bode plot. The impedance is plotted with log frequency on the X-axis and both, the absolute value of the impedance and the phase shift on the Y-axis.
Advanced Diagnostics through EIS
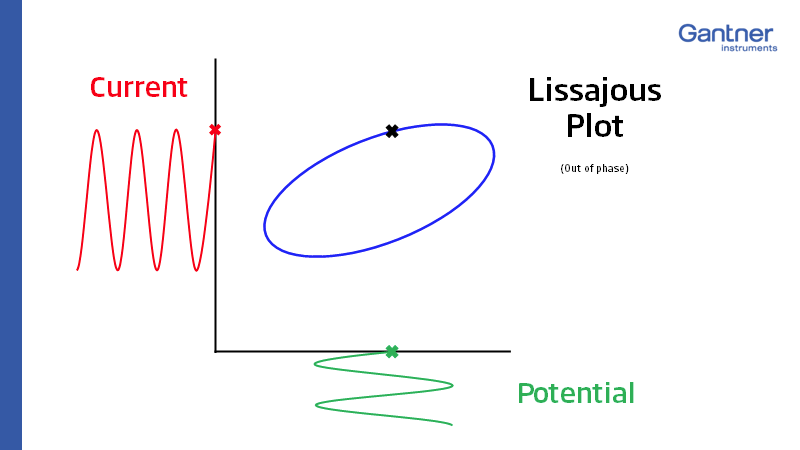
Check for linearity: For quality checks, it is useful to plot the applied sinusoidal current signal on the X-axis and the voltage response signal on the Y-axis. As excitation and response are out of phase, the result will be an oval. This plot is also known as the “Lissajous Figure.”
A further possibility to check the linearity of the system is to plot an FFT of the excitation signal and corresponding response signal. When the system is non-linear the response signal will contain harmonics of the excitation signal in its spectra. The amplitude and number of harmonics can be used to evaluate if this non-linearity causes the quality and accuracy of the impedance measurement. An easier-to-check parameter is the Total Harmonic Distortion (THD), which is an indicator of how much harmonics distort the signal. That means how much the harmonic content influences the fundamental frequency.
How to measure Impedance signals on a high electrical potential
- Current and voltage signals must be recorded synchronously and at a high electrical potential.
- Best signal quality thanks to new measuring card for EIS signals (Q.series X A193)
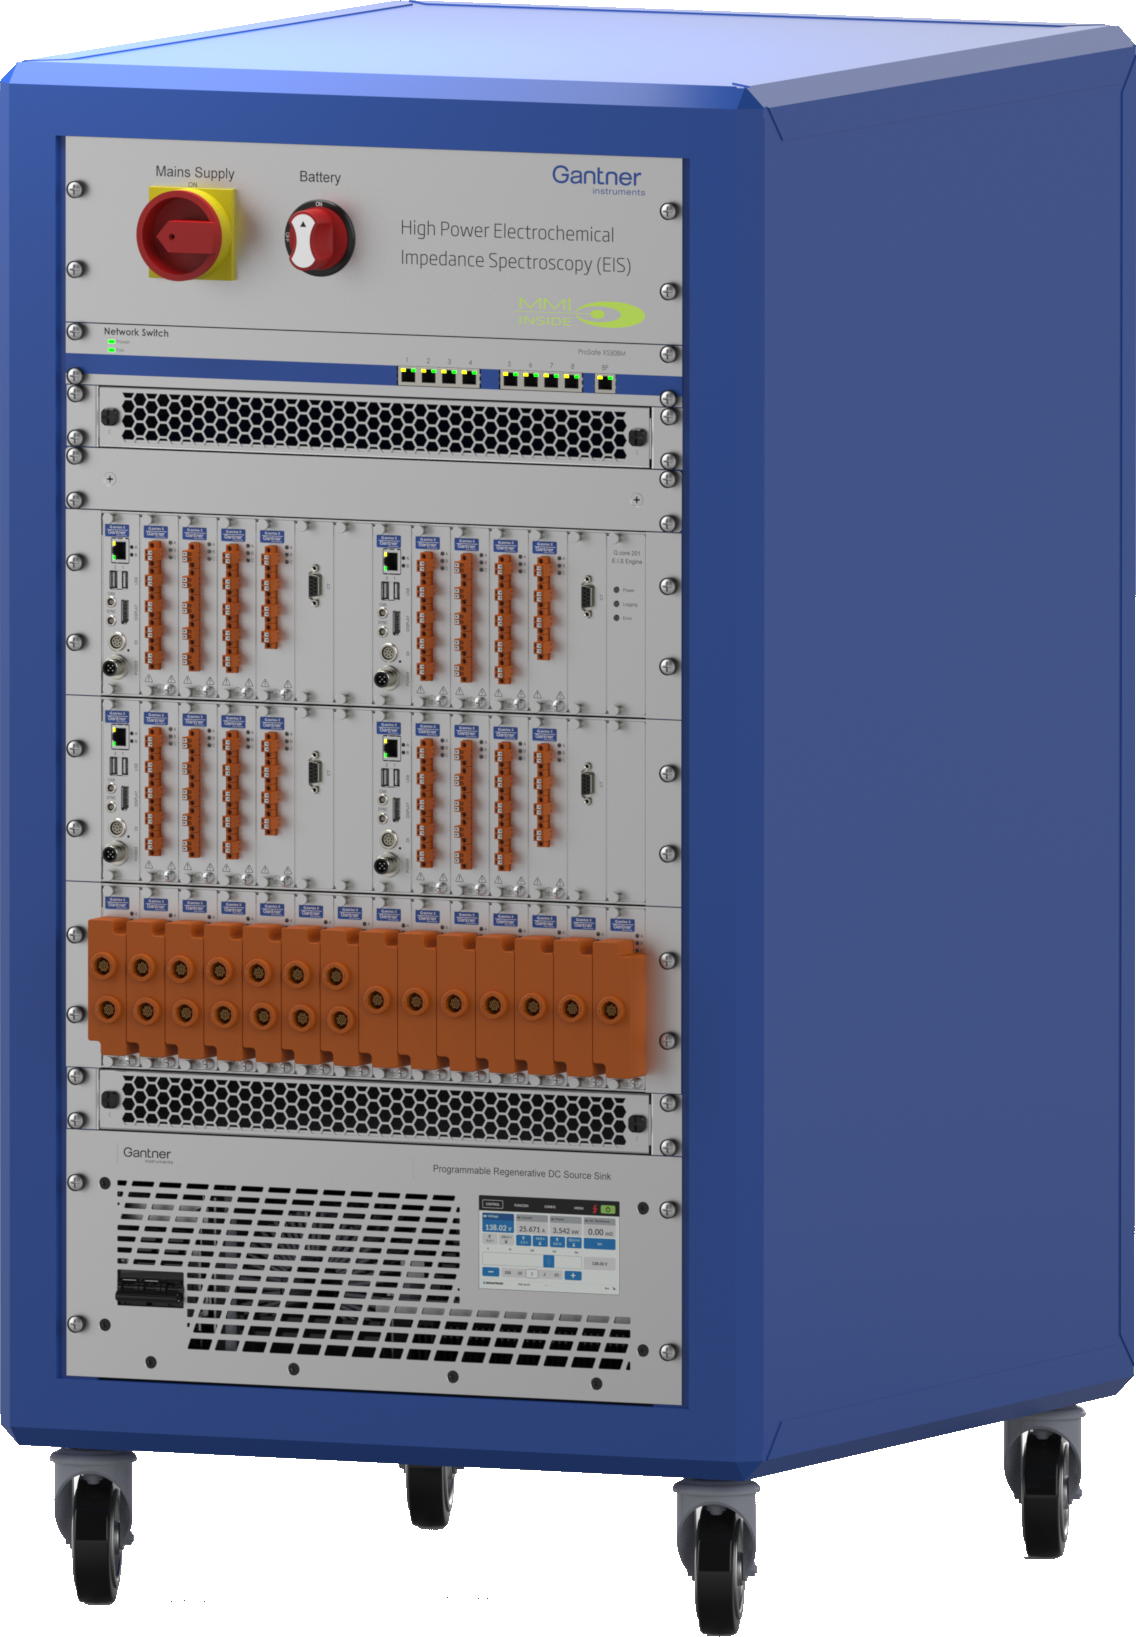
The All-in-one EIS Solution
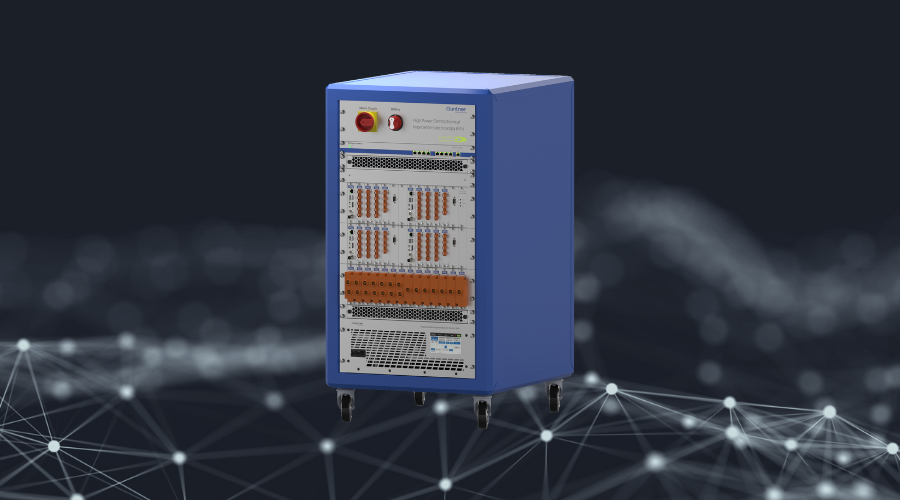
Gantner Instruments’ all-in-one EIS solution meets the requirements of electrochemical impedance spectroscopy (EIS) through its robust design and advanced technical features. The system includes a high-performance Q.series X A193 module, designed for high-power and industrial applications, with capabilities for signal amplification and offset measurement that enhance sensitivity and selectivity in impedance measurements. The voltage measurement range and current measurement flexibility, supported by robust galvanic isolation, ensure accurate and reliable data collection across various applications, including entire battery packs. Synchronous signal collection maintains data coherence and accuracy, utilizing the Lock-In to isolate specific signal frequencies and phases, essential for detecting weak signals in noisy environments. The system’s broad frequency range from 1 mHz to 10 kHz and modular configuration, scalable up to 128 EIS channels, make it suitable for diverse electrochemical testing requirements. Comprehensive data accessibility and real-time visualization tools, including Nyquist and Bode plots, facilitate detailed analysis and immediate feedback. Advanced connectivity options, such as an open API and EtherCAT interface, ensure seamless integration with existing power systems and automation setups. Additional features like high-isolation thermocouple inputs, temperature measurement channels, and an air deflector for heat management further enhance system performance and reliability, making Gantner’s EIS solution a comprehensive and efficient tool for optimizing batteries, fuel cells, and electrolyzers.
Technical Features Q.series X A193
- DAQ Module A193
- Best-in-class synchronization and signal-to-noise ratio
- 4 Voltage Inputs +/-5 V, 100 kHz
- 1 Input for Current measurements (+/-5 V, 100 kHz)
- 800 VDC channel-to-channel, channel-to-power supply, and channel-to-bus
- Analog/Digital Conversion
- Resolution: 24-bit
- Sample rate: 100 kHz per channel
- Sample-by-sample sigma-delta full synchronization
- Digital filters: Infinite Impulse Response (IIR), low-pass, high-pass, Butterworth or Bessel (2nd, 4th, 6th, or 8th order), frequency range 0.1 Hz to 10 kHz (adjustable via software)
- Averaging: configurable or automatic according to the selected data rate
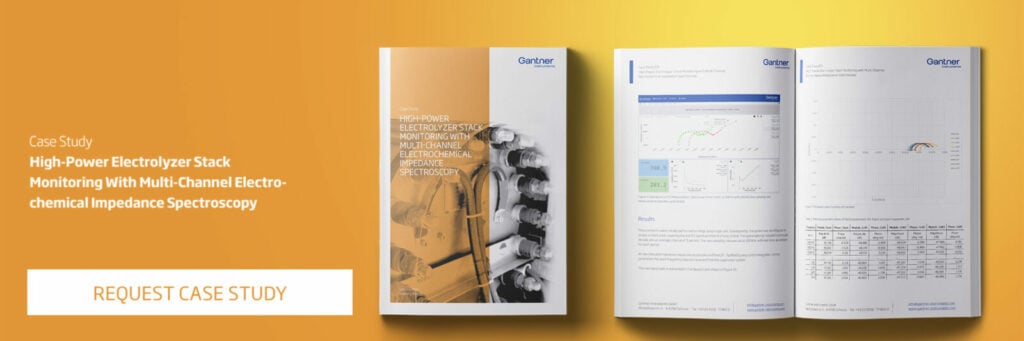
EIS in high-power electrolyzer stack monitoring
This case study examines a real-world application of Gantner Instruments’ advanced multi-channel Electrochemical Impedance Spectroscopy (EIS) technology for monitoring and optimizing high-power electrolyzer stacks providing in-depth insights into our innovative approach while detailing the challenges addressed and the impressive results achieved. Gain valuable knowledge on optimizing electrolyzer performance and extending their operational lifespan through advanced EIS technology.
More articles
Streamlining Data Acquisition at CERN with Blinky-Lite and Gantner Instruments
Safe, secure, and traceable data acquisition is essential in complex, large-scale scientific environments like the European Organization for Nuclear Research (CERN). Reliable remote access is critical to supporting the diverse team members in their data acquisition (DAQ) setup and operations. Collaborating with the Blinky-lite team, we have implemented a test setup that successfully navigates these challenges in constrained environments.
Read more...Measure the evolution of battery technology
New ground-breaking products and powerful solutions for fast and accurate Cell, Module and Pack testing
Read more...Our new fiber optic measurement – without the hassle
Fiber optic measurement methods come with the advantage of being insensitive to interference from the environment. We all know that. What we also know is that actually using them in test and monitoring projects was not so easy so far. Either because there were steep learning curves or simply no integrated DAQ solution available. However, we have great news for you!
Read more...Gantner Instruments at E-TECH Europe 2025
E-TECH EUROPE returns for its fourth edition, bringing together industry leaders who are shaping the future of EV and battery technology.
Read more...